
Architecture in 3D
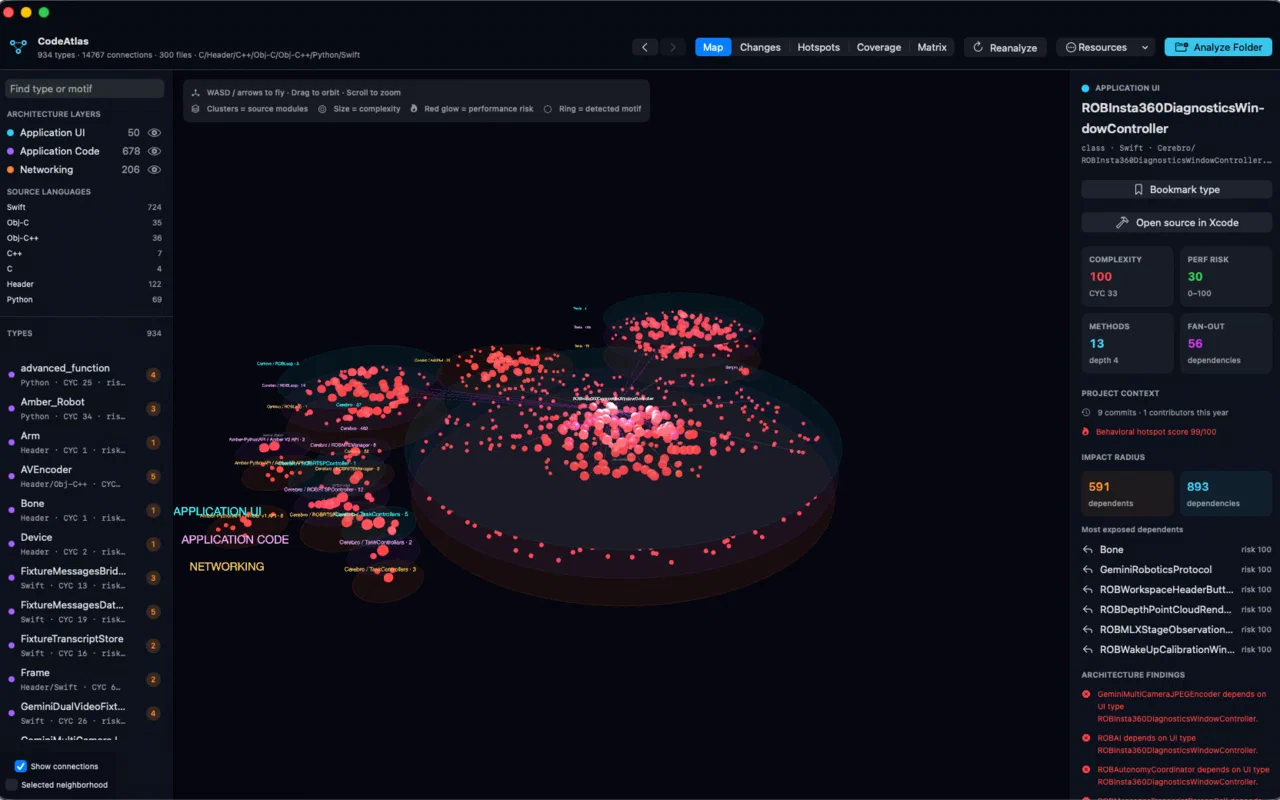
Fly through folders, files, types, functions, and dependencies. Search, isolate, bookmark, and trace the shortest path between any two symbols.
Local-first developer intelligence for macOS
CodeAtlas turns Swift, Objective-C, C, C++, and Python codebases into explorable architecture maps, then layers in Git-aware review, impact paths, hotspots, coverage, architecture rules, and CI-ready findings. Your source stays on your Mac.
One model, five ways to reason
Every workspace uses the same project graph, so context follows you from the broadest system view to the exact relationship behind a risky change.
Fly through folders, files, types, functions, and dependencies. Search, isolate, bookmark, and trace the shortest path between any two symbols.
Compare against a Git baseline, separate added and modified files, and follow every transitive dependent before approving a change.
Combine structural complexity, dependency pressure, code churn, and contributor activity into a prioritized maintenance view.
Import Xcode result bundles, xccov JSON, or LCOV and see weak coverage beside the architecture it is meant to protect.
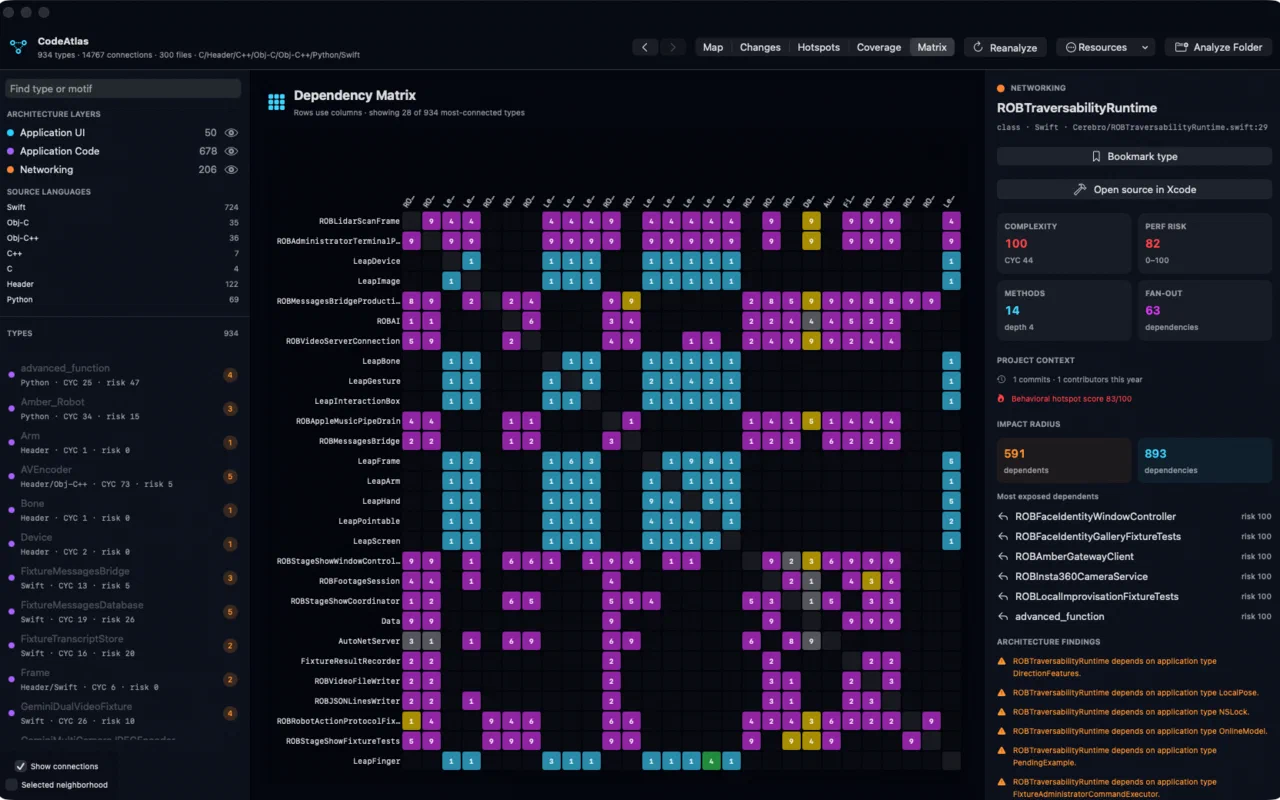
Scan a compact dependency matrix for unexpected coupling, isolated modules, cycles, and relationships that do not fit the intended design.
Live analysis, without the blind wait
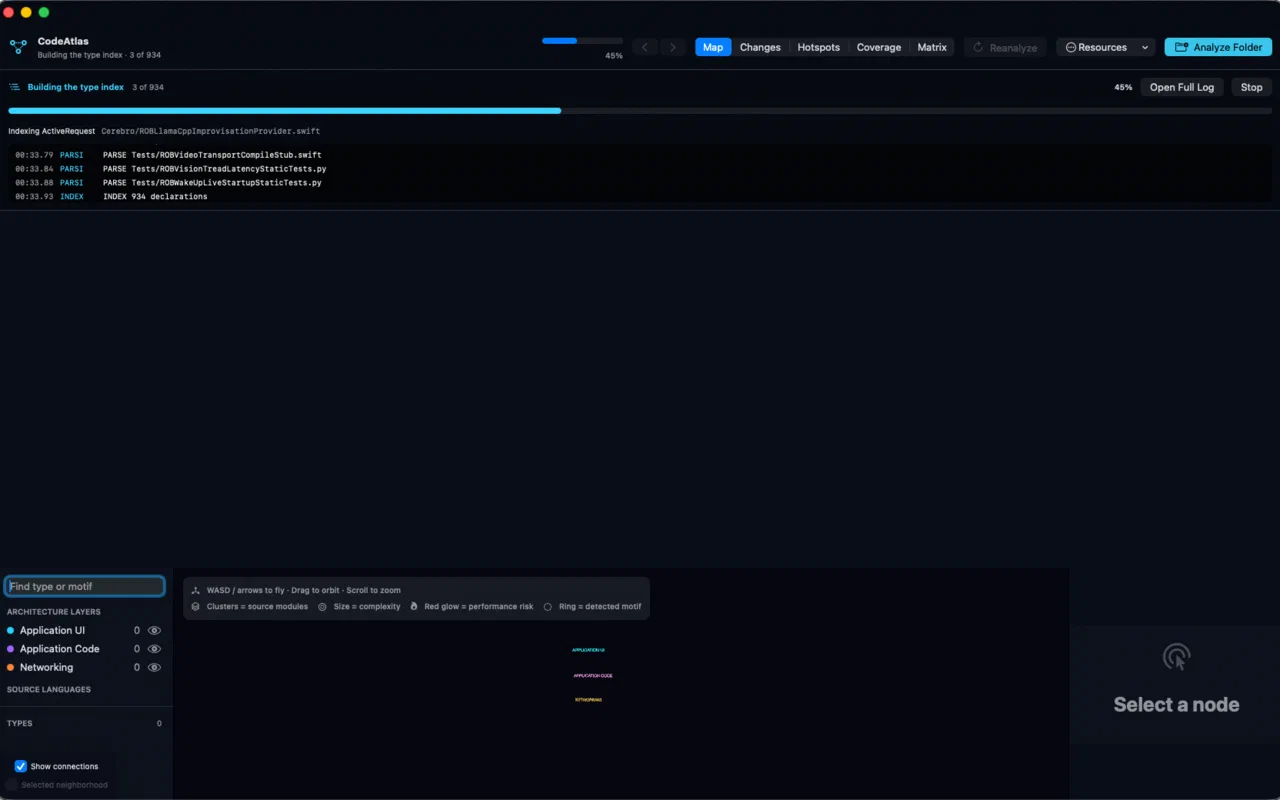
Large repositories take real work to understand. CodeAtlas now reports overall progress, the active phase, exact file counts, and a live console while your graph is built.
Responsive at large-project scale
The dependency matrix is prepared on a background index and focuses on the most-connected types, so a graph with hundreds of symbols stays explorable instead of freezing the interface.
Deeper relationships, still build-free
Optional call enrichment adds likely function relationships to the map while preserving the fast, source-first workflow. CodeAtlas also reports the semantic tooling already present on your Mac—including SourceKit-LSP, clangd, and compilation databases—so teams can see which deeper analysis paths are available.
Designed to be explicit: inferred calls are a fast beta signal, not a claim of compiler-exact resolution. You decide when to enable them.
Architecture as an executable agreement
Define lightweight layer rules and let CodeAtlas identify relationships that cross them. Cycle detection finds strongly connected areas that make systems difficult to separate, test, or replace.
Catch dependencies that contradict the direction your team intended.
Surface groups that can no longer evolve independently.
Select a finding and return to its files, symbols, and surrounding graph.
Prioritize where engineering attention pays back
Hotspots combine churn and contributor history with graph pressure. Coverage overlays add test evidence. Quality gates bring the signals together without hiding the ingredients behind a single opaque score.
Rank files where frequent edits and dense dependencies make the cost of mistakes unusually high.
Import existing reports and see weak coverage on the same map used to reason about architecture.
Combine new risk, architectural findings, and available coverage into a CI-friendly review result.
From the desktop to every pull request
Run the same local-first project analysis from the CodeAtlas command-line target. Export JSON for your own tools, emit SARIF for code-scanning interfaces, or install the included GitHub Actions template and fail a review when new risk crosses the gate.
$ CodeAtlasCLI ./MyProject \
    --baseline origin/main \
    --sarif codeatlas.sarif \
    --json-output codeatlas.json \
    --fail-on-risk

Analyzed 186 files · 1,420 nodes · 4,968 relationships
Quality gate: REVIEW
3 architecture findings · 2 new high-risk files
Built for the investigation loop
Reopen recent security-scoped project folders directly from the welcome screen.
Optionally watch the project fingerprint and refresh the model as source files change.
Navigate back and forward across an investigation without rebuilding your mental path.
Pin important files and symbols so the next question starts from known landmarks.
Narrow the graph by name, type, relationship, change state, or lens.
Share graph JSON, findings, and starter CI workflow files without sharing source.
What’s new in this release
The release opens with an in-app briefing and keeps these notes available from the CodeAtlas menu, so every new capability has a clear starting point.
Map, Changes, Hotspots, Coverage, and Matrix turn one project model into purpose-built views.
Choose a baseline and inspect changed files, commit activity, contributors, and blast radius.
Trace dependencies, dependents, and the shortest route between important symbols.
Check layer direction and circular relationships before design drift becomes permanent.
Rank hotspots, import coverage, and evaluate a transparent quality gate.
Run analysis from the CLI and export graph JSON, SARIF, or a GitHub Actions workflow.
Return to recent projects, watch for changes, bookmark nodes, and revisit selection history.
Eight guided tutorials live inside the app and remain available whenever you need a reset.
Tutorial center
Open Tutorials from the CodeAtlas menu or Resources control. Each lesson explains the goal, the controls to use, and what to look for in your own graph.
See every lessonOpen a project, orbit the graph, use keyboard flight controls, search, and inspect a symbol.
Select a Git baseline and move from changed files to the dependencies each change can affect.
Follow direct and transitive dependents, then find the shortest path to a consumer.
Describe intended layers, read violations, and identify circular components.
Interpret churn, ownership, graph pressure, and complexity without treating a score as truth.
Import an Xcode or LCOV report and focus testing on risky, weakly protected code.
Enable the beta option, distinguish inferred edges, and review toolchain readiness.
Export the workflow, generate SARIF, and choose when new risk should block a pull request.
Support without a data handoff
Project parsing, Git inspection, graph construction, coverage import, and exports run locally. CodeAtlas does not need an account or a source-code upload to explain your architecture.
Select a repository or folder containing Swift, Objective-C, Objective-C++, C, C++, or Python source. CodeAtlas understands the common source and header extensions for those languages, and analysis does not require a successful build.
Analysis is read-only. Exports are created only where you explicitly save them, and live reanalysis watches for changes without editing source.
No. The optional inferred-call layer is labeled beta and is designed as an additional navigation signal. Toolchain readiness is reported separately.
Yes. Export the graph as JSON, findings as SARIF, or a GitHub Actions starter workflow for repository automation.
Start in the in-app Tutorial Center, review the open-source project, or contact Orbitus Robotics for product support.
CodeAtlas for macOS
Explore the source today and follow the first Mac App Store release from Orbitus Robotics.