
ROB Viper / Guided workflows / 2026-11-19
From a question
to inspectable evidence.
Review a binary, understand local devices, and run a scoped investigation with a plan you can inspect. Follow fifteen workflows with fourteen screenshots of the actual Mac interface.
0.8.1 (19) development preview. These features are implemented and installed in the development build. A public production Viper installer remains pending. Publishing this guide is not an app release.
Updated manual: 51 pages, 39 unique native UI images, 4.52 MiB. New workflows use synthetic training fixtures. Earlier captures retain their historical captions.
Enable bounded binary review
Open Threat Center with Command-Shift-T, then choose Binary review.
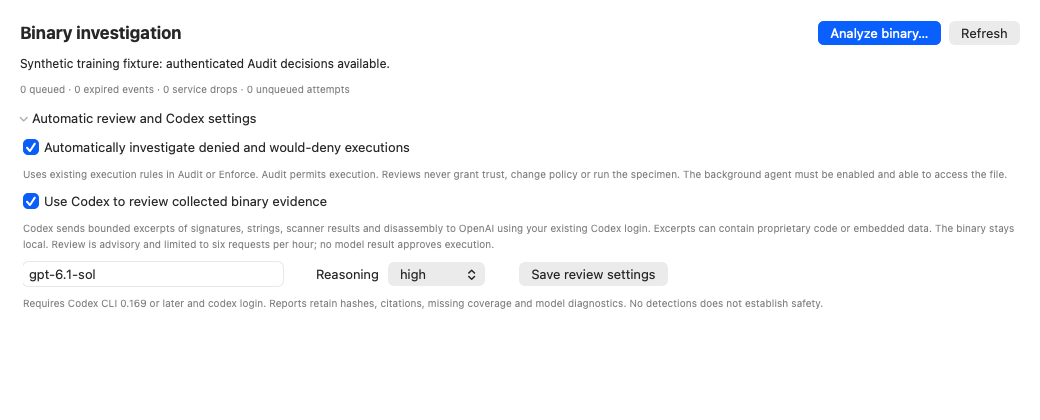
Inspect a file safely
Choose Analyze binary… and select a regular executable. Viper snapshots and hashes it, collects bounded static evidence and disassembly, and uses available scanners. The specimen is not launched.
Check automatic coverage
Expand Automatic review and Codex settings. Automatically investigate denied and would-deny executions uses authenticated execution-policy decisions. The active execution mode must be Audit or Enforce, with the background agent enabled and a recent heartbeat.
Choose model sharing explicitly
Use Codex to review collected binary evidence sends bounded signature, string, scanner and disassembly excerpts to OpenAI through your existing Codex login. Excerpts may contain proprietary code or embedded data; the full binary stays local. Choose the model/reasoning, then Save review settings.
Check the outcome. Audit allows the launch while recording Would deny. A review is advisory: it never grants trust or changes policy. Monitor only does not supply authorization decisions. Codex CLI 0.169+ and login are required; model requests are limited to six per hour.
Back to workflow index ↑Read an advisory binary result
Select a case in Binary review and compare its identity, evidence and collection limits.
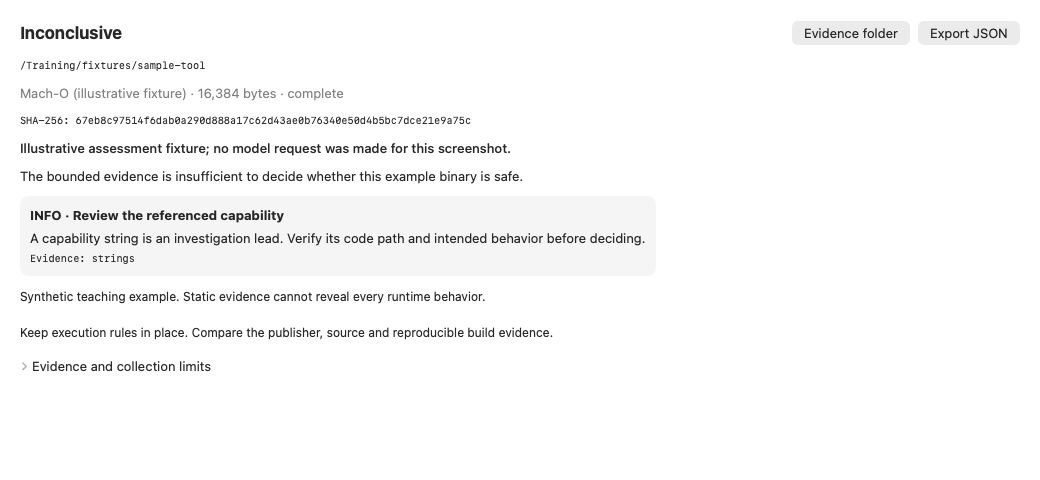
Bind the result to the file
Check the path, format, byte count and SHA-256. An authorization-triggered case also records the decision, policy revision and event ID.
Follow the cited evidence
Read the model status and finding evidence IDs. Expand Evidence and collection limits; use Evidence folder to inspect retained tool output. Missing tools, truncation and unsupported formats remain gaps.
Keep the verdict bounded
Inconclusive and no indicators in reviewed evidence are not proof of safety. Compare trusted source/build evidence before making a separate policy decision. Export JSON saves the case report; retain the private evidence folder too.
Check the outcome. This pictured assessment is an explicitly synthetic teaching fixture. No model request or specimen analysis was performed for the screenshot. Static analysis cannot guarantee that a binary is free of hidden or delayed behavior.
Back to workflow index ↑Configure and discover your networks
Open Network Control with Command-Shift-N, select Local network, then open Router settings.
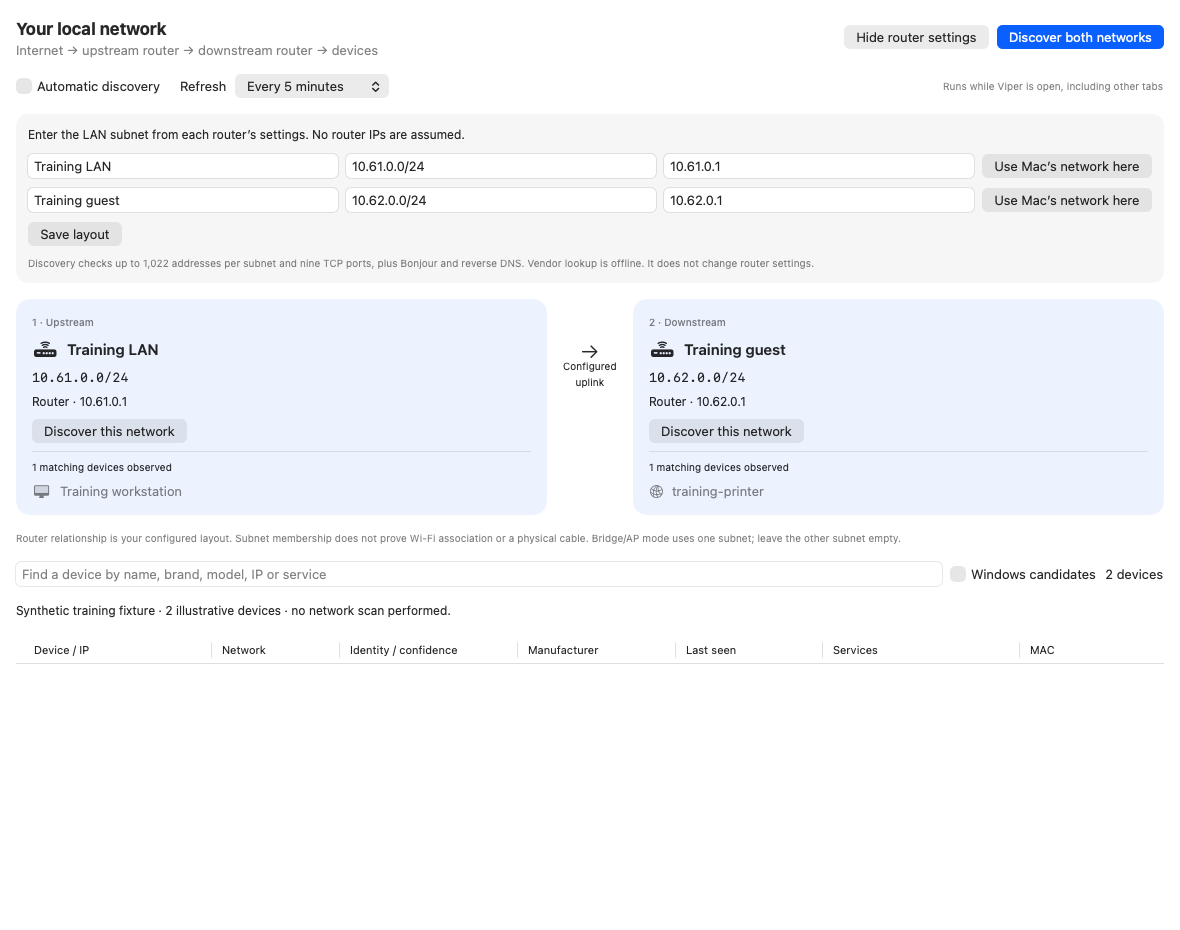
Save the authorized layout
Enter one or two private IPv4 subnets from your router configuration, with names and optional router addresses. Use Mac’s network here fills the observed local network. Select Save layout. Bridge/AP layouts usually need one subnet; leave the other empty.
Discover a bounded scope
Choose Discover this network or Discover both networks only for networks you are authorized to inspect. The scanner checks at most 1,022 addresses per subnet and nine fixed TCP ports, plus Bonjour and reverse DNS; vendor lookup is offline.
Understand scheduled refresh
Automatic discovery runs while Viper is open, even on another tab. Choose the refresh interval or turn it off. Stop cancels collection. A changed network can pause automatic scanning until you review the layout.
Check the outcome. The router diagram is your configured layout, not proof of physical cabling or Wi-Fi association. No response does not mean a device is absent. Discovery does not enable network filtering.
Back to workflow index ↑Inspect and name an observed device
Select a device row in Local network; its evidence panel appears below the table.
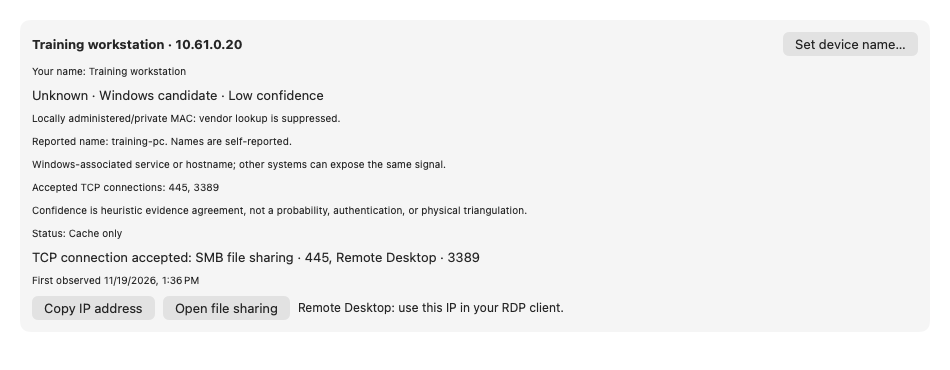
Read confidence and freshness
Compare identity reasons, private/known MAC, observed services and the last response time. Windows candidates is a heuristic filter, not authenticated operating-system detection.
Add a useful local name
Choose Set device name…, enter a label, then Save name. Use discovered name removes your override. The discovered name and evidence remain available.
Review identity changes
Labels follow a known MAC; without one they follow the network address. Recheck labels after address reassignment or private-MAC changes. Opening file sharing starts a separate connection; discovery alone does not.
Check the outcome. The screenshot uses Training workstation and synthetic 10.61.0.20. A custom name expresses your label, not a verified device identity.
Back to workflow index ↑Create an investigation scope
In Network Control, select Investigations and choose New investigation.
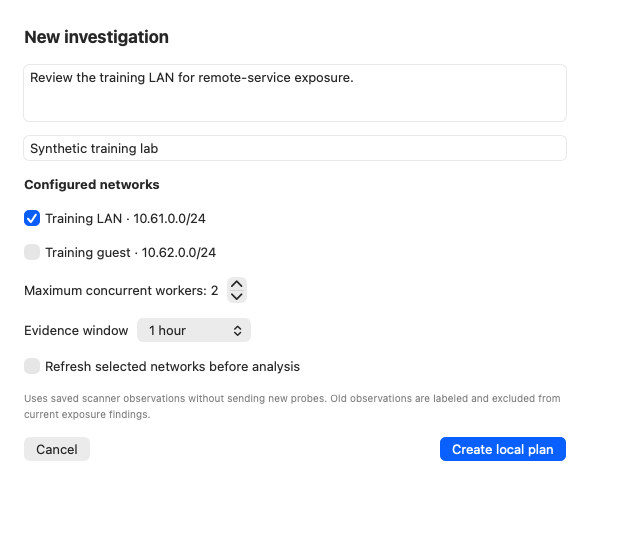
State the defensive question
Enter a goal and a network label. Select only the configured networks you intend to investigate. Configure missing subnets in Local network first.
Bound workers and history
Choose one to four concurrent workers and a 15-minute, one-hour, six-hour or 24-hour evidence window. Worker concurrency is separate from the scanner’s bounded host probes.
Choose saved or fresh evidence
Leave Refresh selected networks before analysis off to use saved observations. Enabling it causes fixed TCP probes when the reviewed plan runs. Select Create local plan; creation itself starts no workers.
Check the outcome. Old observations remain labeled and do not become fresh exposure findings. Saved-only applies to this case: the separate Automatic discovery setting can still refresh while Viper is open. Review it in Local network.
Back to workflow index ↑Review the plan before running
The Plan view shows each built-in worker, its reason and its dependencies.
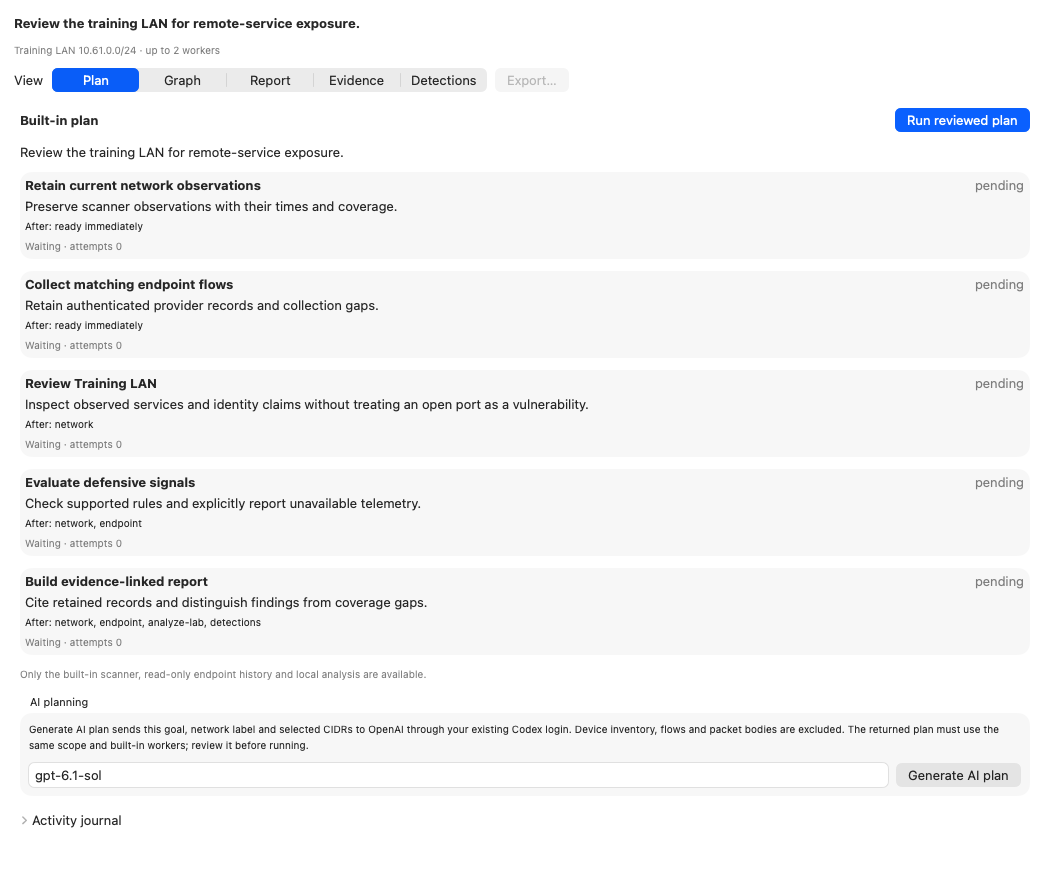
Check the scope and task order
Confirm the goal, selected CIDRs and worker limit above the Plan tab. Read the network snapshot, endpoint collection, per-network analysis, defensive signals and report tasks.
Keep execution explicit
Choose Run reviewed plan only after checking the plan. Neither creating a local plan nor requesting an AI plan starts collection. Policies are unchanged by investigation workers.
Use the available worker catalog
These are bounded native collectors and analyzers. They do not provide arbitrary shell execution, remote RedAgent commands, remediation or additional tool/provider integrations.
Check the outcome. The screenshot shows a built-in local plan. Pending means the worker has not run. After lists its required predecessors.
Back to workflow index ↑Ask Codex to arrange the workers
Scroll to AI planning at the bottom of a new, unstarted Plan.
Review what leaves the Mac
Generate AI plan sends the goal, network label, selected CIDRs and scope settings to OpenAI through your existing Codex login. Device inventory, flows and packet bodies are excluded. Avoid secrets in the goal.
Request a scoped proposal
Use your configured Codex model and choose Generate AI plan. The returned plan must retain the scope and use supported built-in workers. Invalid responses are rejected; a failed request leaves the existing plan available.
Review the saved proposal
Check the resulting plan before choosing Run reviewed plan. AI planning has a 240-second limit and six attempts per hour. A local plan is available without a model request.
Check the outcome. AI planning and binary-evidence review have different sharing scopes. Enabling binary review does not automatically send investigation evidence to the planning model.
Back to workflow index ↑Follow concurrent worker progress
After running the reviewed plan, keep Viper open and watch the Plan view.
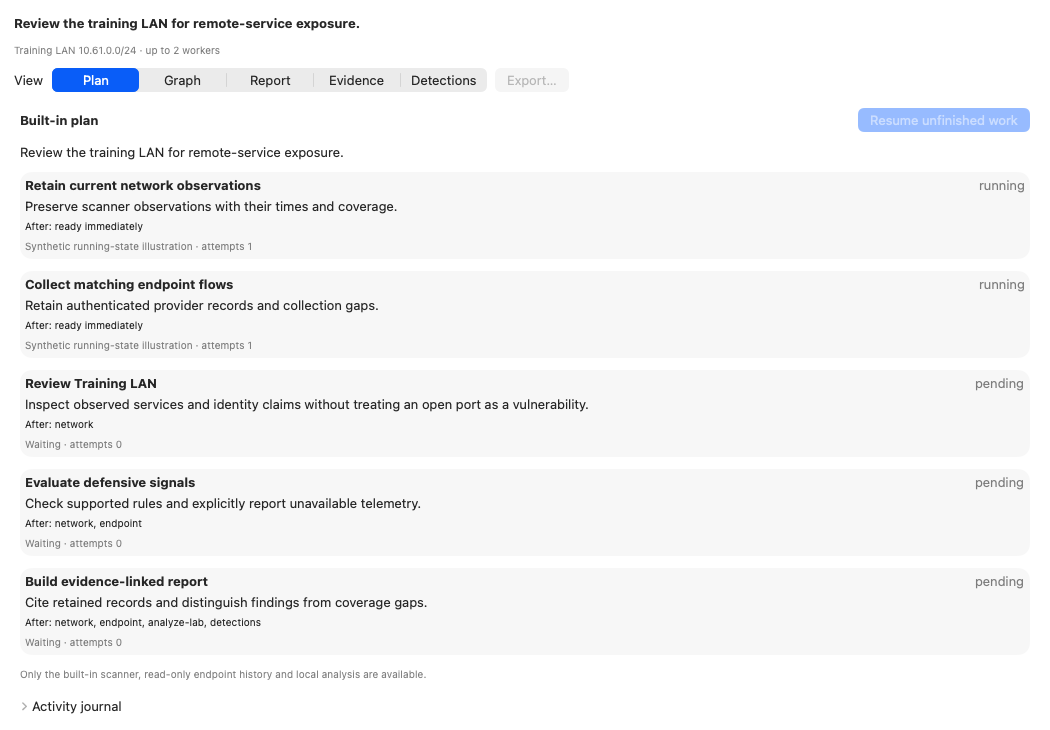
Read status and attempts
Independent collection tasks can run together up to the selected limit. Dependent analysis waits for its required evidence. A running badge is progress, not a completed measurement.
Stop deliberately
Stop work in the Investigations header cancels ongoing work and retains collected evidence. Let the state settle before deciding whether to resume.
Distinguish background services
Orchestration workers require the main app to remain open. The separate binary-review/scheduled-scan background agent has its own registration, heartbeat and logged-in-user requirements.
Check the outcome. The running badges in this image are a synthetic UI state illustration. They are not a live network test.
Back to workflow index ↑Explore the persistent graph
Select Graph after collecting evidence to see how the case is connected.
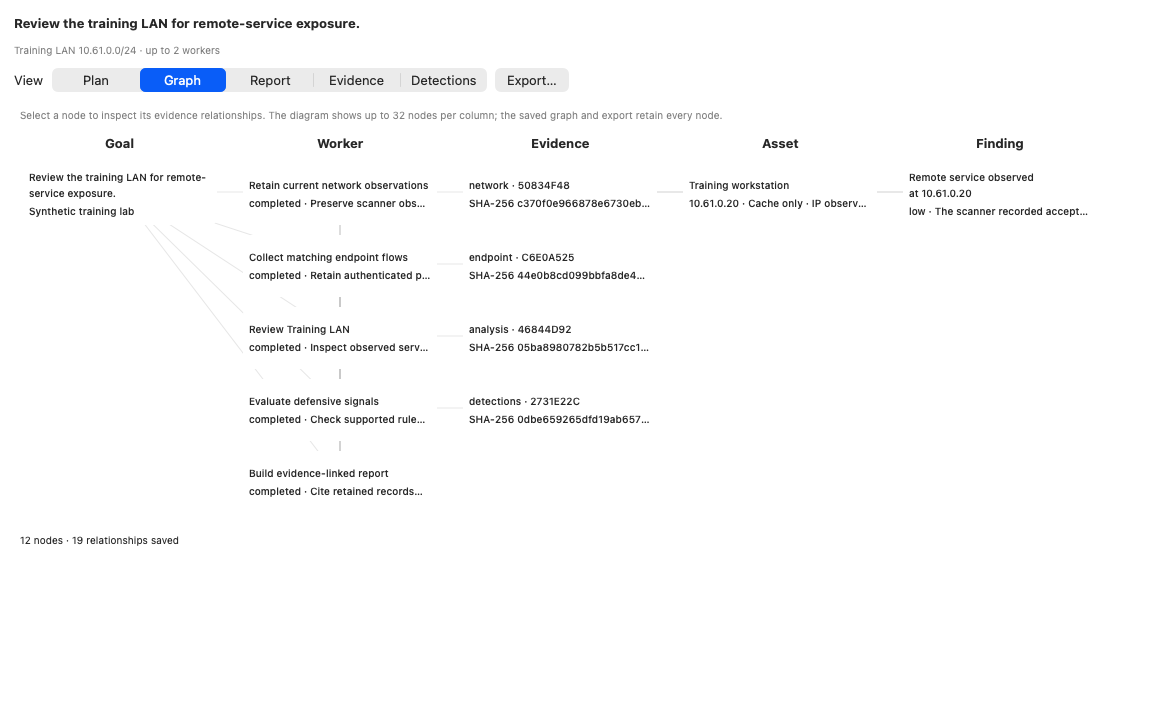
Follow the evidence chain
Read the Goal, Worker, Evidence, Asset and Finding columns. Connections record which worker produced an artifact and which evidence supports an asset observation or lead.
Select a node
Click a node to highlight its links and read the relationship details below the graph. Scroll horizontally or down if needed. A graph node does not by itself confirm malicious activity.
Keep the full case
The display shows up to 32 nodes per column. The saved case and export retain all nodes and edges. Reopen Viper and select the saved case to continue reviewing it.
Check the outcome. This graph was produced by the real orchestration pipeline over synthetic evidence. Asset nodes represent observed IP records, not authenticated physical-device identity.
Back to workflow index ↑Read the evidence-linked report
Select Report and begin with its completion state, evidence revision and coverage.
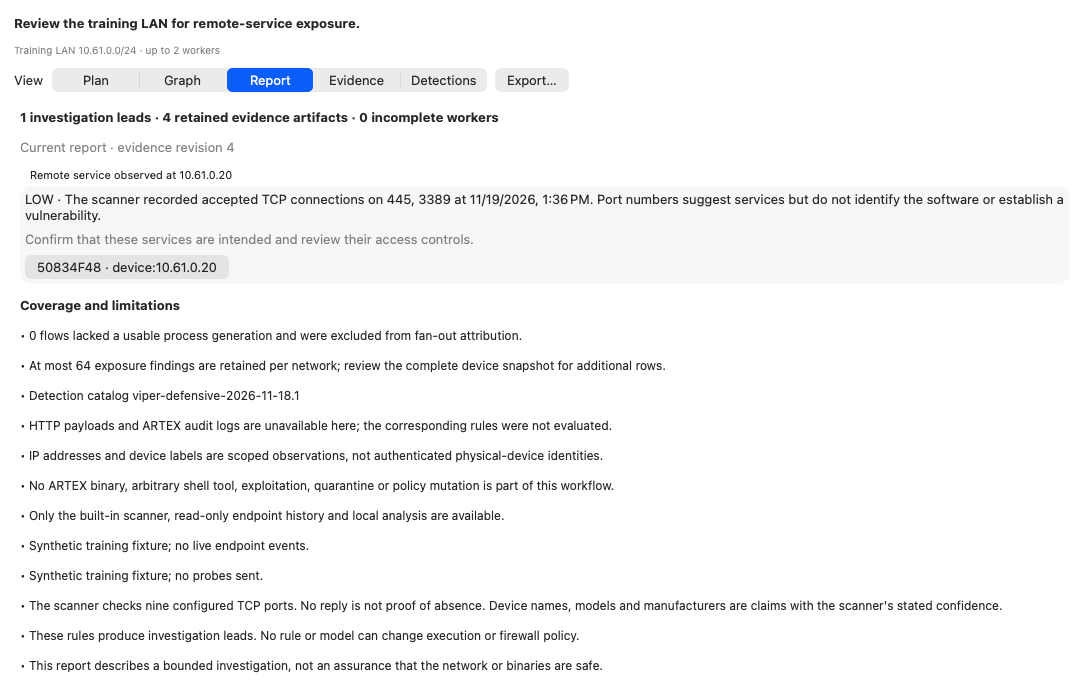
Read the finding as a lead
An observed remote service is exposure to review, not proof of a vulnerability or compromise. Read the explanation and recommendation before deciding what action is appropriate.
Open the citation
Select the artifact/record citation under a finding. Viper verifies the retained artifact’s SHA-256 and opens the source evidence. Use the cited record ID to locate the supporting observation.
Check the report revision
Current report means the report matches the case’s plan and evidence revision. It does not mean every collector succeeded. Always read Coverage and limitations.
Check the outcome. The synthetic example exposes SMB/RDP on a training IP. Viper has not exploited the service, logged into the device or changed its configuration.
Back to workflow index ↑Retain and export the evidence
Select Evidence to inspect retained artifacts before exporting a case.
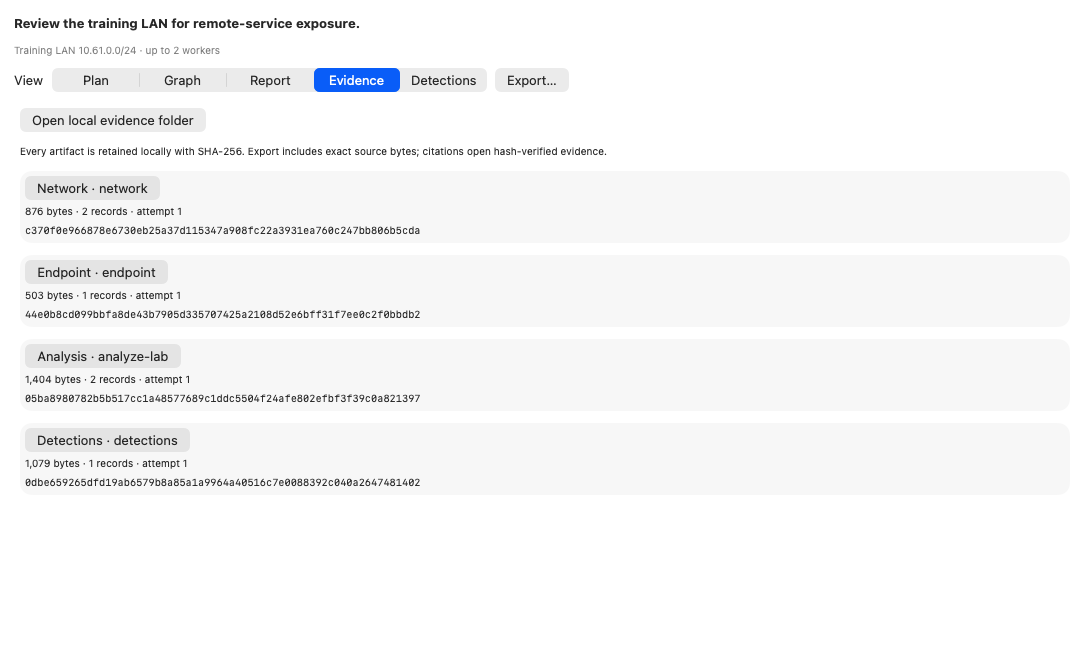
Compare artifact identity
Each card records kind, worker, byte count, record count, attempt and SHA-256. Click the artifact to inspect its retained content.
Export the current case
Choose Export… and a private destination. The JSON bundle includes the report, graph, citations and exact retained source bytes. Source bytes are encoded in the bundle; keep the complete file.
Review before sharing
Network labels, addresses, device names, executable paths and records may be sensitive. Export is a local save, not an upload. Keep the private original and create a separately reviewed sharing copy if necessary.
Check the outcome. The full artifact is exported even when the evidence inspector truncates its display. Export is enabled for a current report, including a partial report with explicit gaps.
Back to workflow index ↑Verify the cited source record
A report citation opens the retained source artifact with its identity above the text.
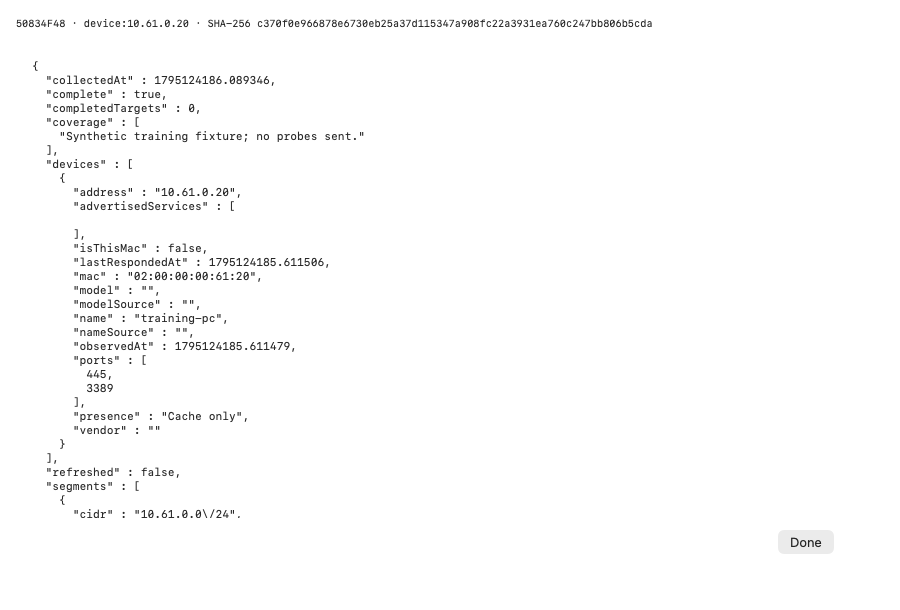
Match the citation
Compare the artifact ID, record ID and SHA-256 shown with the finding and evidence list. The inspector opens the whole verified artifact, not only the cited record.
Read the original fields
Locate the cited observation and inspect address, ports, time and coverage. Hash verification establishes unchanged retained bytes; it does not authenticate the remote device or prove a claim true.
Use the complete export when needed
The on-screen text is limited to 256 KiB. A truncation notice means the full artifact must be read from the private export or evidence folder. Choose Done to return.
Check the outcome. If verification fails, retain the error and original case. Restore a known original or collect a new case; do not edit the expected hash to hide a mismatch.
Back to workflow index ↑Recognize incomplete coverage
A partial report preserves useful evidence while clearly stating missing work.
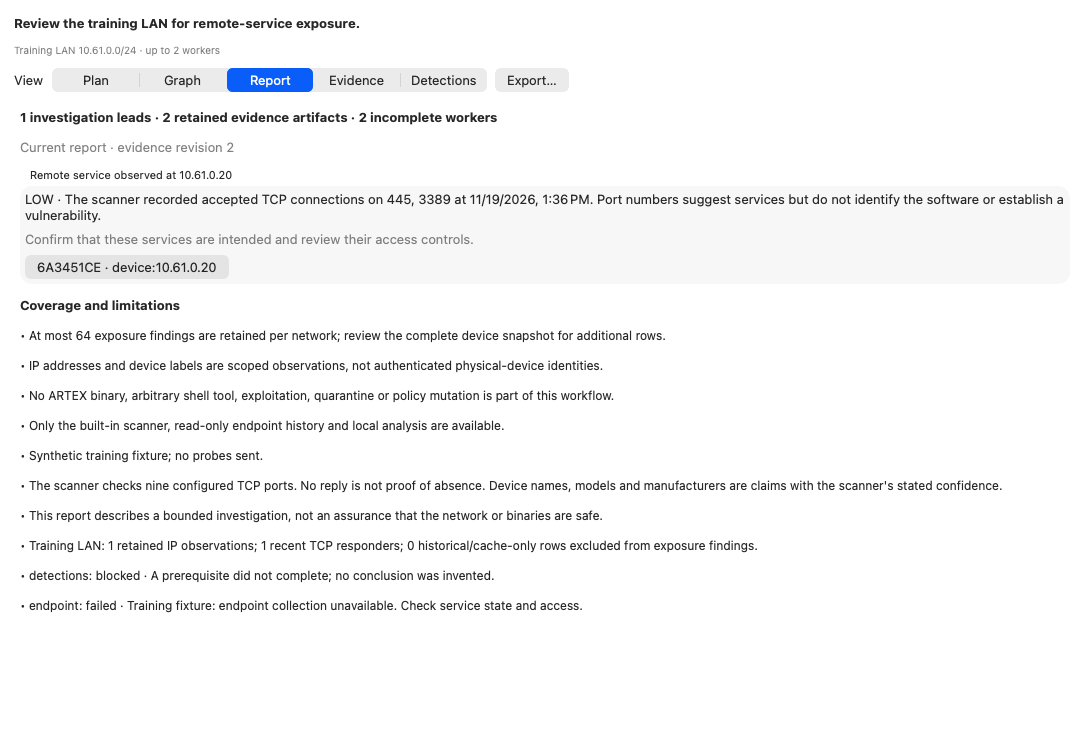
Separate findings from gaps
Read Coverage and limitations even when a report is current. A network snapshot can support an exposure lead while unavailable endpoint history prevents other detections.
Check the actual service state
An activated extension or connected provider is not necessarily collecting. Check execution collection and saved-policy access separately from Network Control filtering and recorded history.
Repair the stated prerequisite
Follow the setup/status guidance for the missing service or access. Do not reset rules or weaken protections to make a report appear complete. If the source is unavailable, retain the partial report as partial.
Check the outcome. The endpoint failure here was injected for teaching. It demonstrates the same coverage distinction needed when collection is stopped or protected policy access fails.
Back to workflow index ↑Resume only unfinished work
Reopen the saved investigation and return to Plan after resolving the reported prerequisite.
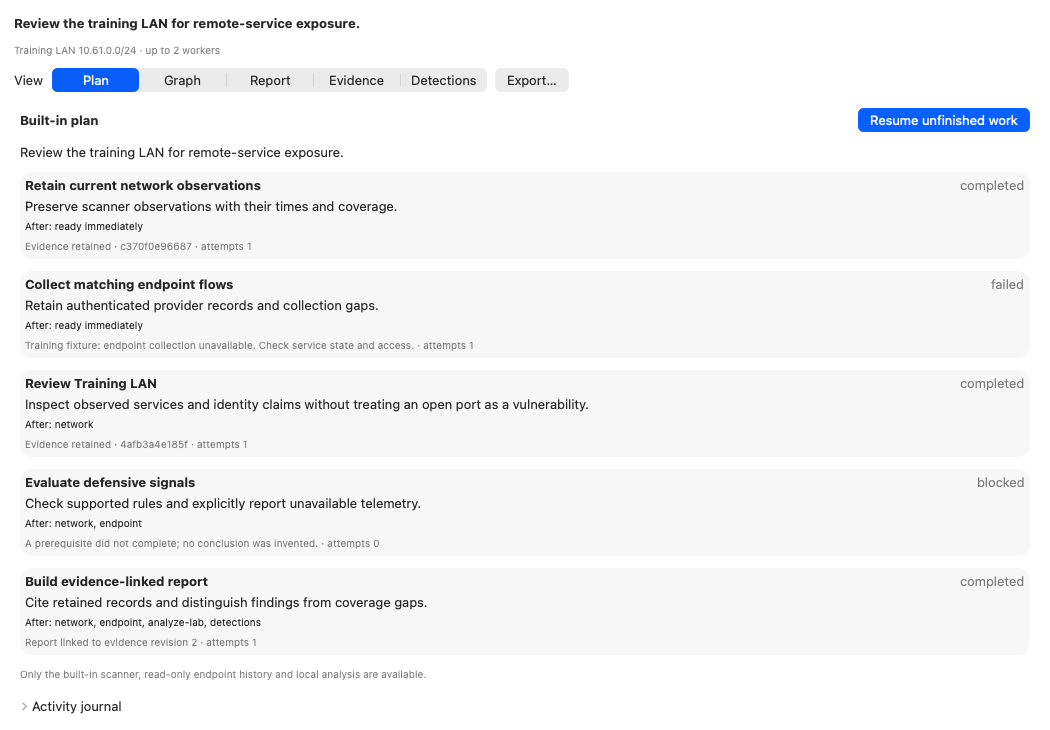
Inspect failed and blocked tasks
Failed identifies the worker that could not collect; blocked identifies dependent work that lacked required evidence. Review each message and attempt count.
Resume explicitly
Choose Resume unfinished work. Completed measurements are retained rather than silently replayed. No automatic resume occurs when the app reopens after an interruption.
Start a new case for fresh evidence
If completed network evidence is now too old for your question, create a new scoped investigation with the intended refresh choice. After a resume, read the revised report and coverage again.
Check the outcome. Durable plans, journals and evidence survive app restarts. This does not make orchestration an always-running background investigator.
Back to workflow index ↑Understand the detection catalog
Select Detections to read each rule’s required telemetry, condition and limitations.
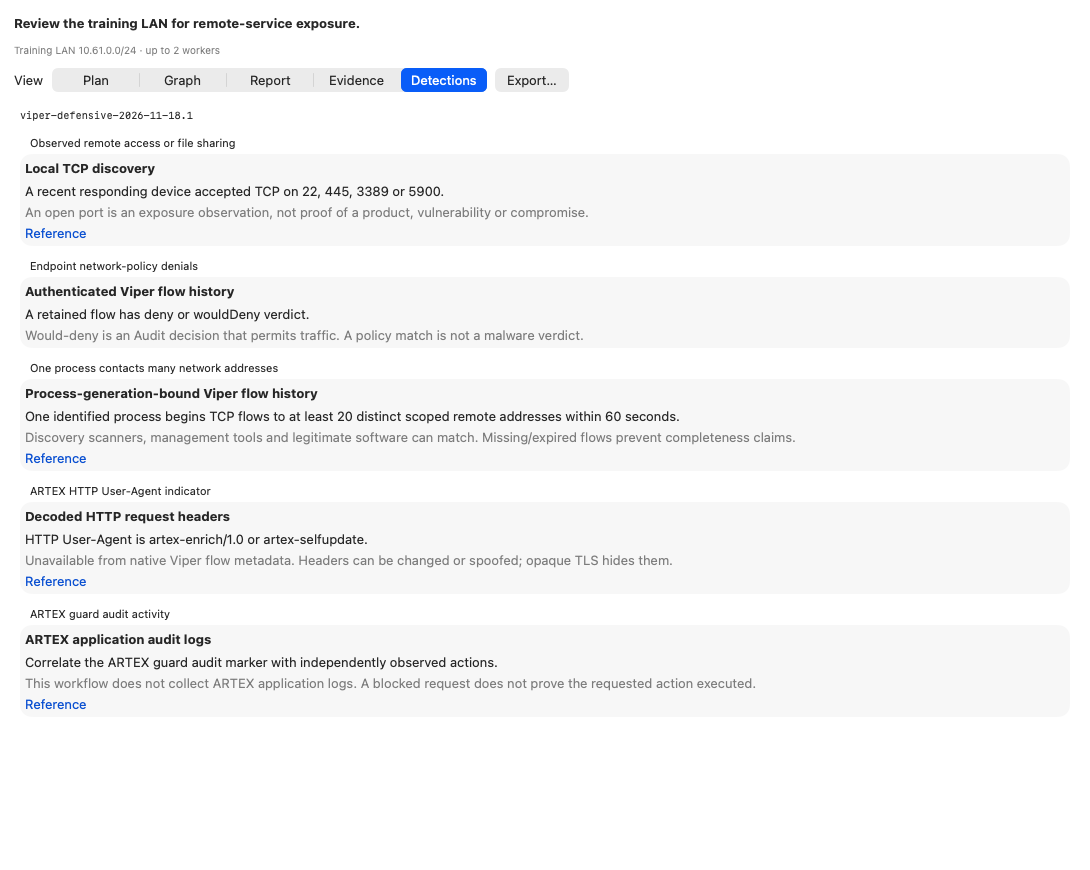
Use supported native leads
The initial catalog checks recent remote-service exposure, network-policy Deny/Would deny flow records, and per-process TCP fan-out of at least 20 distinct IPs within 60 seconds. Process generation and the selected evidence window constrain correlation.
Check missing telemetry
No records or missing endpoint coverage is not a negative security verdict. Native detections require appropriate retained observations; a dormant filter or missing retained flow history leaves gaps.
Treat external material as experimental
The repository includes authored Sigma and Suricata ARTEX HTTP User-Agent examples. They are not deployed or validated by an external engine. Viper does not currently collect HTTP headers or ARTEX guard logs.
Check the outcome. ARTEX is not executed or required by this feature. Additional model providers, external tools, SIEM/log adapters and remote RedAgent execution remain deferred.
Back to workflow index ↑